Friday 24 August 2007

The case of the missing metrics...

Yesterday, I helped Phil install MonAMI on the Durham CE and update his Ganglia web front-end so it now has the nice graphs.

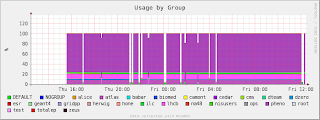
However, we hit a snag: a few of the metrics "disappear" every so often. This is most likely happening because gmond is loosing the UDP (multicast) metric update messages. After "a while" (the DMAX value), gmond assumes that the metric is no longer being monitored and purges it. The purged metrics no longer have their data written to the RRD file by gmetad, leaving a gap in the graph.

When we encountered this with Glasgow it was caused by incoming UDP packets overflowing gmond's network buffer. The ganglia MonAMI plugin has a work-around: every 200 packets it will pause "a while" (100 ms by default). Looks like this isn't enough for Durham.

The long term solution is for someone to fix gmond: it should be multithreaded (to stop gmetad downloads from blocking metric updates) or for it to accept data using a reliable transport (e.g. TCP).

Wednesday 15 August 2007

The "external" repository

How do you best configure Ganglia to work with MonAMI? What's a good Nagios configuration? MonAMI is designed to fit in with existing monitoring tools; but, sometimes those external tools need to be tweaked to get the best out of the available data.

External is a collection of scripts, configuration hints, and similar "useful stuff". It's material not for MonAMI, but rather for the programs MonAMI communicates with (hence "external").

The current focus has been on getting decent graphs within Ganglia. External has a framework for building RRDTool graphs, pie charts, and frames of related information. It also includes a fair number of examples showing how to use the framework. The torque and maui frames are excellent examples: see the output from UKI-SCOTGRID-Glasgow.

For now, external is available as a CVS module (browse, instructions).

Enjoy!

New release: v0.9

Yes, finally release v0.9.

This new version is the first to feature Torque and Maui monitoring plugins and includes a better Ganglia plugin.

At the moment, the Torque plugin is limited to monitoring the number of jobs in each queue (and queue-group) and the efficiency (CPU time / wallclock time) in 5 bands (0%-20%, 20%-40%, etc).
I'm hoping to add support for asynchronous monitoring by watching the accounting log files. MonAMI already has a generic file-watcher component, so this should be fairly straight forward.

The Maui plugin is quite primitive, compared to what it could monitor. At the moment its limited to providing just the fair-share information (still very useful!), but I'd guess there's more information that could be gathered.

The ganglia plugin is now looking pretty nice. It has a dmax value (so ganglia will purge old metrics automatically) which is based on how long (in practice) it took to gather the data. So, if the computer slows down substantially, it'll carry on working.

The plugin also has a number of work-arounds for problems with Ganglia. For example, when MonAMI is monitoring torque and maui, it can provide hundreds of metrics. If gmond (the ganglia daemon) doesn't consume them fast enough, some will be lost, so MonAMI pauses whilst sending the metrics, allowing gmond to prevent metric loss.

Its alive

Yes, here's a new blog about MonAMI; some news from the sharp end of monitoring. Promising new, rants, planned features and random ideas, all about the world of computer monitoring.