Tuesday, 18 September 2007

Storing monitoring data in a database? no problem!

Ganglia is a monitoring system that uses RRDTool for its storage and graphs. This provides an excellent solution for monitoring, but suffers from data becoming less detailed ("averaged out") when you look further back in time. This is deliberate, but does make later analysis of the data difficult.

If you wanted to keep detailed records of monitoring data with MonAMI that don't degrade over time, now you can, I've committed changes to the mysql plugin in CVS. In addition to monitoring a MySQL database, the plugin can now store information. You tell it which table and how to map the information into that table and it does the rest, it'll even create the table if it doesn't exist.

Wednesday, 5 September 2007

Greetings from CHEP 2007!


Greetings from Victoria!

For those that thought things have been a bit quiet recently; well, yes, they have been. Recently, all my time has been spent preparing for the CHEP 2007 and All Hands 2007 conferences.

CHEP has now started, with various GridPP people here. Graeme, Greig and myself are giving a poster-presentation of MonAMI at CHEP. The poster is deliberately "visual": I'm aiming to use it to talk people through the concepts, rather than providing a poster that has lots of text.

For those interested, the poster was put together using Inkscape: a SVG editor. The whole poster is made up of SVG graphics with the only exception of the GridPP backgrounds and University logos (which are, unfortunately, large bitmaps). Inkscape is a very powerful editor. If you are doing anything involving SVG, I would recommend inkscape. Be sure to take the tutorials: they're both easy to follow and will greatly increase your productivity.

CHEP itself is an excellent conference. There's lots of people in the HEP computing field often facing similar computational challenges. I'm looking forward to meeting more people during the poster sessions.

Monitoring grid jobs by VO from the RBs point-of-view.


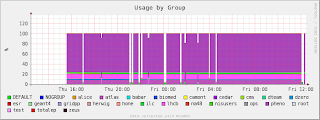
Gidon Moont (of the 3D Real-Time Monitor fame) has come up with another monitoring tool. Using the data collected from all the WLCG Resource Brokers, graphs are generated that plot the number of jobs each VO has running and queued at your site. More information is available at the Real Time Monitoring page (the "GridLoad Graphs" section).

What's particularly nice is he's included support for Google Gadgets. Gadgets, if you've not come across them, are a small bit of web content wrapped up so they're easy to handle. You can add Gadgets to iGoogle, to your desktop or even within to your webpages.

MonAMI includes a framework that (amongst other things) extends Ganglia's default web front-end to include support for Gadgets (e.g. Glasgow's Torque monitoring).

So, with Google Gadgets, you can see your local batch system monitoring side-by-side with a per-VO view of what the Resource Brokers think your site is up to.

Friday, 24 August 2007

The case of the missing metrics...

Yesterday, I helped Phil install MonAMI on the Durham CE and update his Ganglia web front-end so it now has the nice graphs.

However, we hit a snag: a few of the metrics "disappear" every so often. This is most likely happening because gmond is loosing the UDP (multicast) metric update messages. After "a while" (the DMAX value), gmond assumes that the metric is no longer being monitored and purges it. The purged metrics no longer have their data written to the RRD file by gmetad, leaving a gap in the graph.

When we encountered this with Glasgow it was caused by incoming UDP packets overflowing gmond's network buffer. The ganglia MonAMI plugin has a work-around: every 200 packets it will pause "a while" (100 ms by default). Looks like this isn't enough for Durham.

The long term solution is for someone to fix gmond: it should be multithreaded (to stop gmetad downloads from blocking metric updates) or for it to accept data using a reliable transport (e.g. TCP).

Wednesday, 15 August 2007

The "external" repository

How do you best configure Ganglia to work with MonAMI? What's a good Nagios configuration? MonAMI is designed to fit in with existing monitoring tools; but, sometimes those external tools need to be tweaked to get the best out of the available data.

External is a collection of scripts, configuration hints, and similar "useful stuff". It's material not for MonAMI, but rather for the programs MonAMI communicates with (hence "external").

The current focus has been on getting decent graphs within Ganglia. External has a framework for building RRDTool graphs, pie charts, and frames of related information. It also includes a fair number of examples showing how to use the framework. The torque and maui frames are excellent examples: see the output from UKI-SCOTGRID-Glasgow.

For now, external is available as a CVS module (browse, instructions).

Enjoy!

New release: v0.9

Yes, finally release v0.9.

This new version is the first to feature Torque and Maui monitoring plugins and includes a better Ganglia plugin.

At the moment, the Torque plugin is limited to monitoring the number of jobs in each queue (and queue-group) and the efficiency (CPU time / wallclock time) in 5 bands (0%-20%, 20%-40%, etc).
I'm hoping to add support for asynchronous monitoring by watching the accounting log files. MonAMI already has a generic file-watcher component, so this should be fairly straight forward.

The Maui plugin is quite primitive, compared to what it could monitor. At the moment its limited to providing just the fair-share information (still very useful!), but I'd guess there's more information that could be gathered.

The ganglia plugin is now looking pretty nice. It has a dmax value (so ganglia will purge old metrics automatically) which is based on how long (in practice) it took to gather the data. So, if the computer slows down substantially, it'll carry on working.

The plugin also has a number of work-arounds for problems with Ganglia. For example, when MonAMI is monitoring torque and maui, it can provide hundreds of metrics. If gmond (the ganglia daemon) doesn't consume them fast enough, some will be lost, so MonAMI pauses whilst sending the metrics, allowing gmond to prevent metric loss.

Its alive

Yes, here's a new blog about MonAMI; some news from the sharp end of monitoring. Promising new, rants, planned features and random ideas, all about the world of computer monitoring.